Infrastructure Operations

As traditional customers transition towards cloud-based infrastructures, the need for an efficient tool to manage and monitor deployments across on-premises and cloud data centers grows exponentially. This shift has elevated infrastructure operations to a critical role within vSphere+.


Timeline
Dec 2019 ~ May 2022
Early access in 2020
Initial access in 2021
General Access in 2022

My role
Design Lead
Interaction Design
User Research
Cross-functional teams alignment

Team
Other 2 Designers from vSAN & vROps
Product Manager
UI and Backend Engineers
Content Writer

Identify User Problem

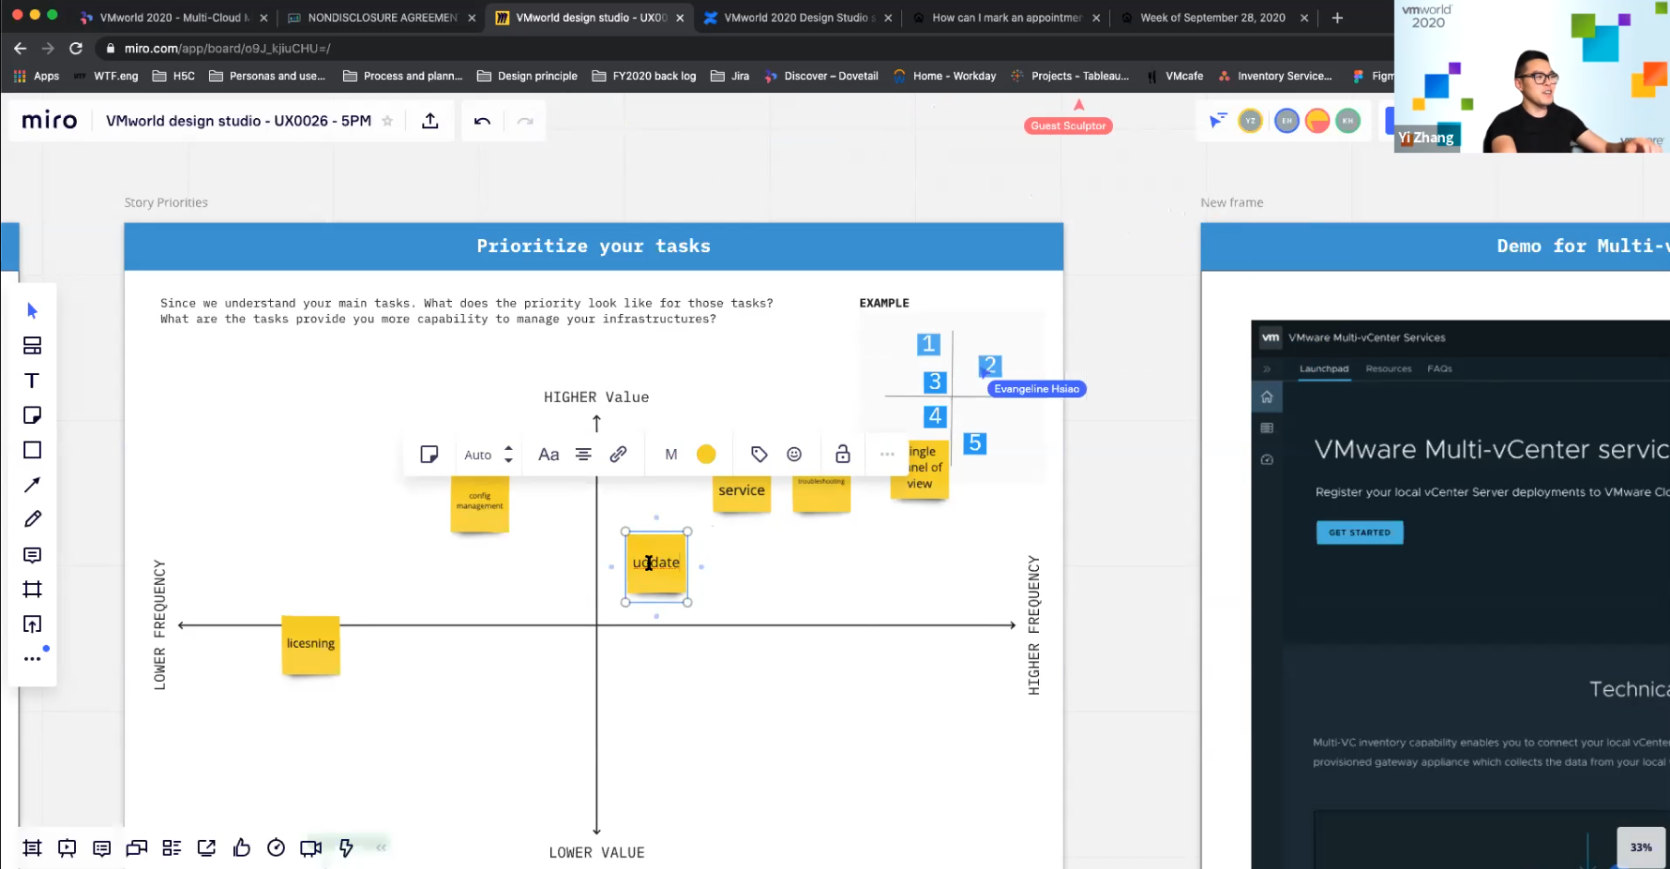
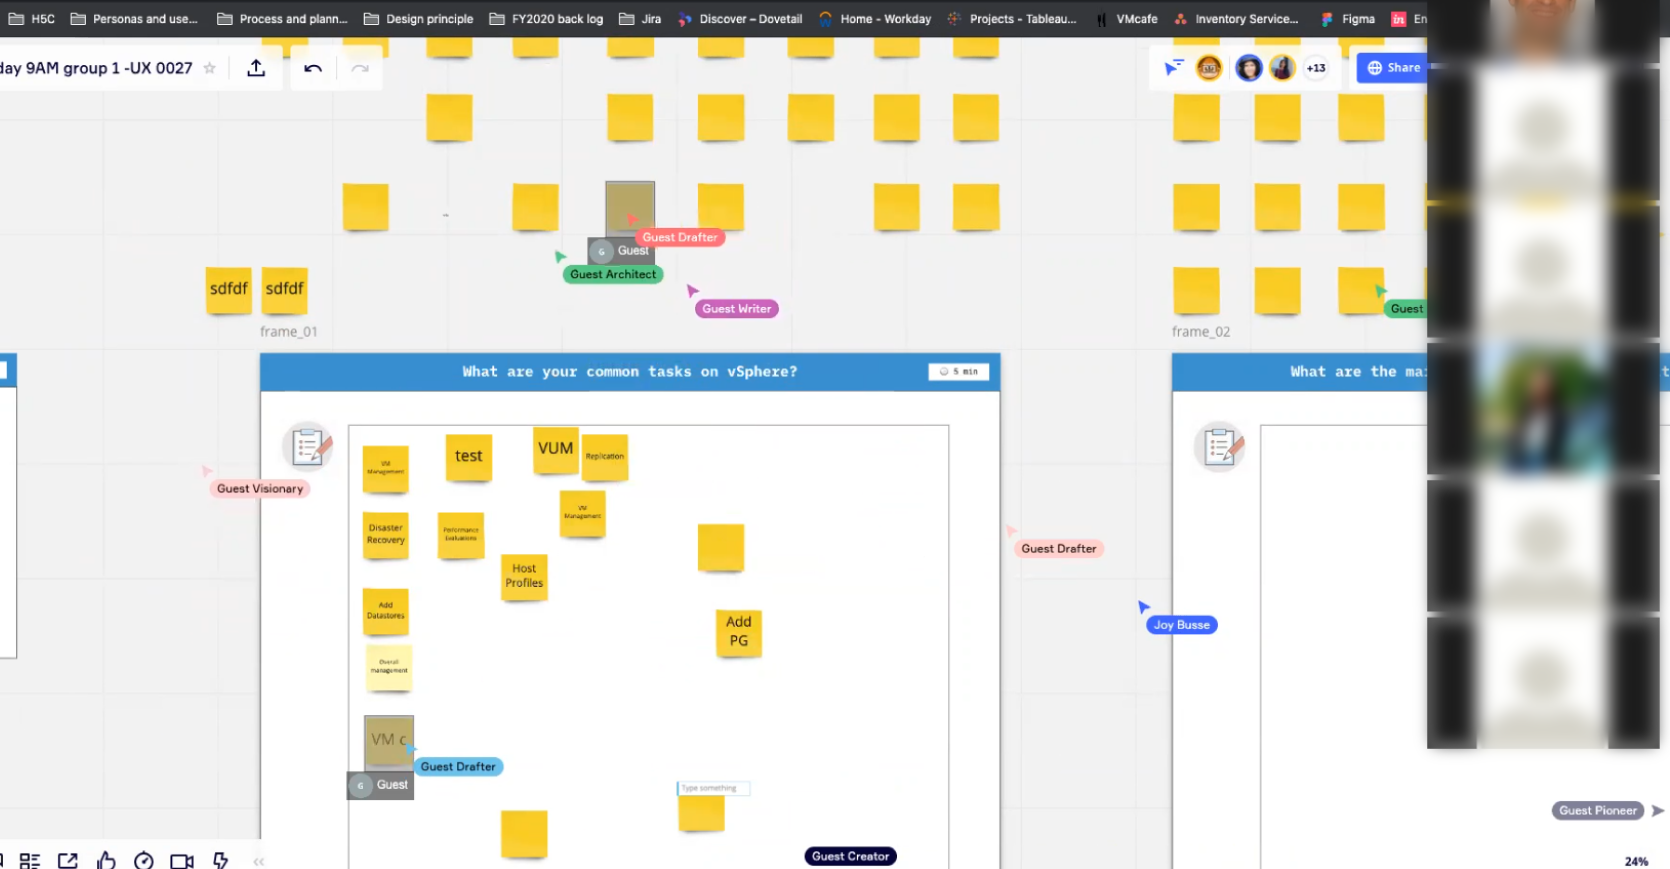
I facilitated 8 workshops with 83 customers. The main goal for the workshop is to understand who are the personas, their current challenges on managing multiple data centers collectively and their top use cases for the day-to-day life.

VMware Operations — user problem research findings panel 1
VMware Operations — user problem research findings panel 2

Prioritize Use Cases

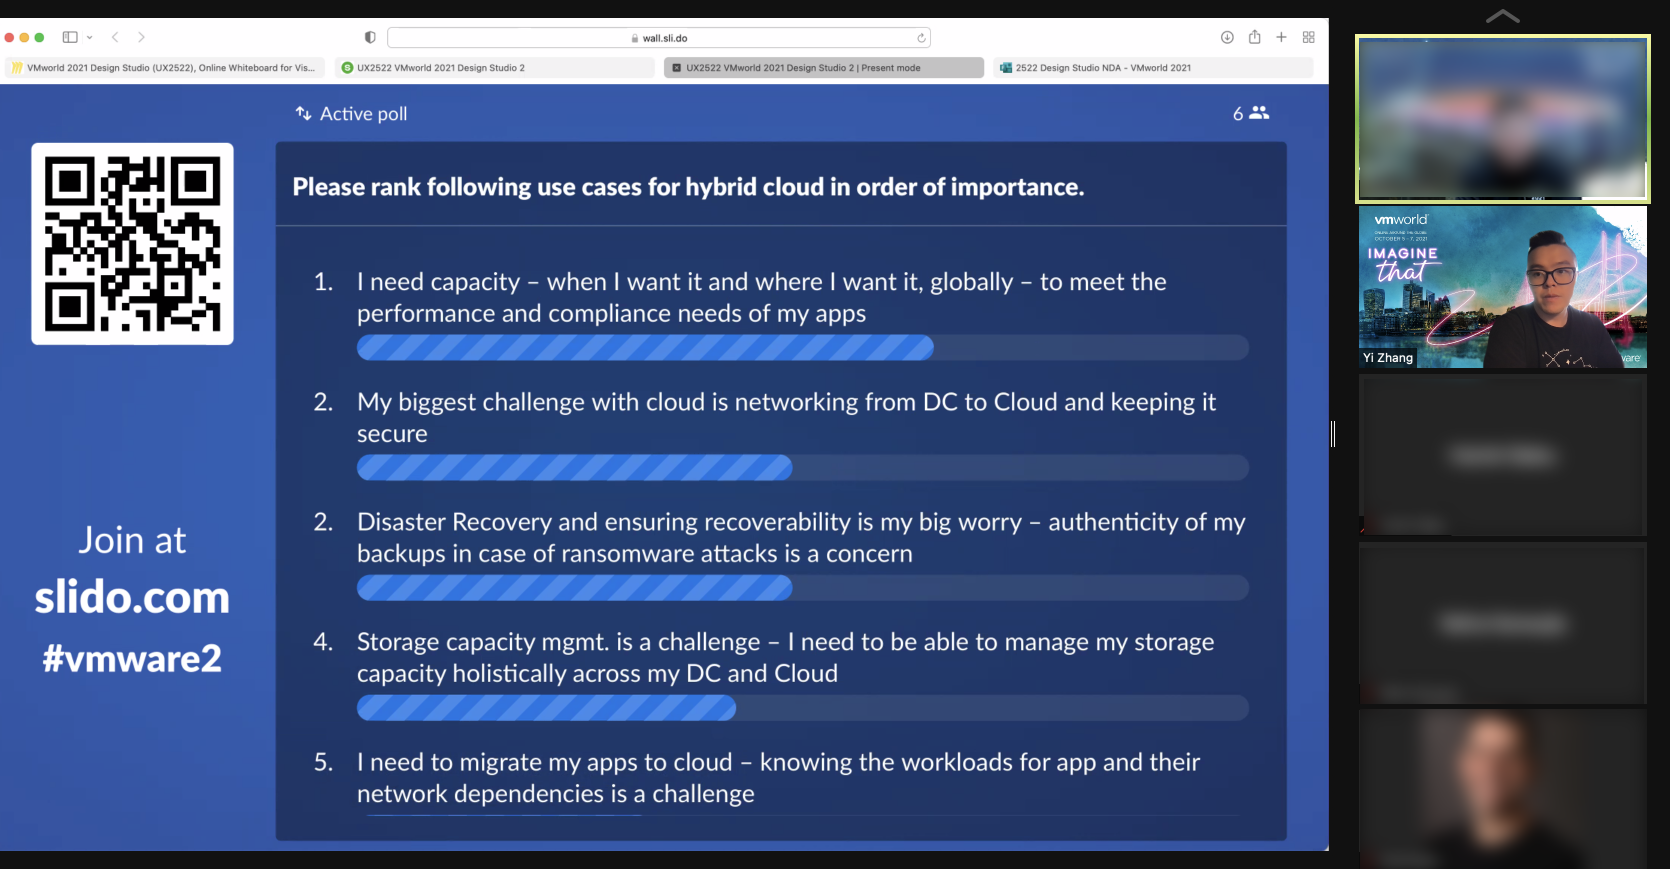
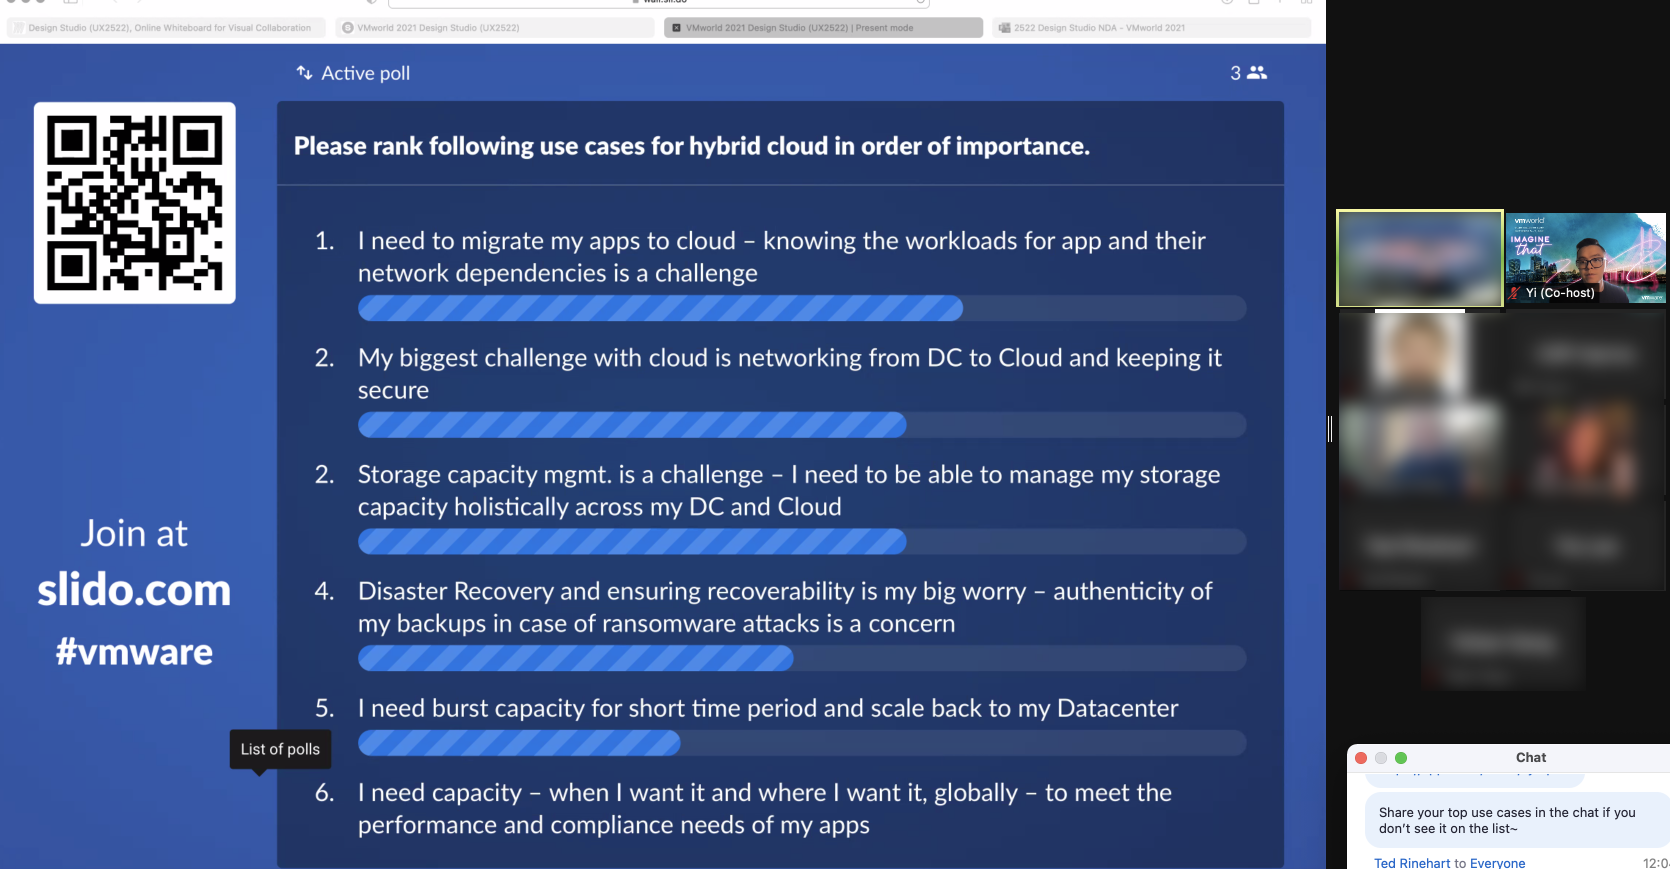
By analyzing the insights from research sessions. There are three main use cases that users are expecting: troubleshooting errors, managing capacity, monitoring security risk.

VMware Operations — use case prioritization matrix
VMware Operations — use case prioritization results

Target Users

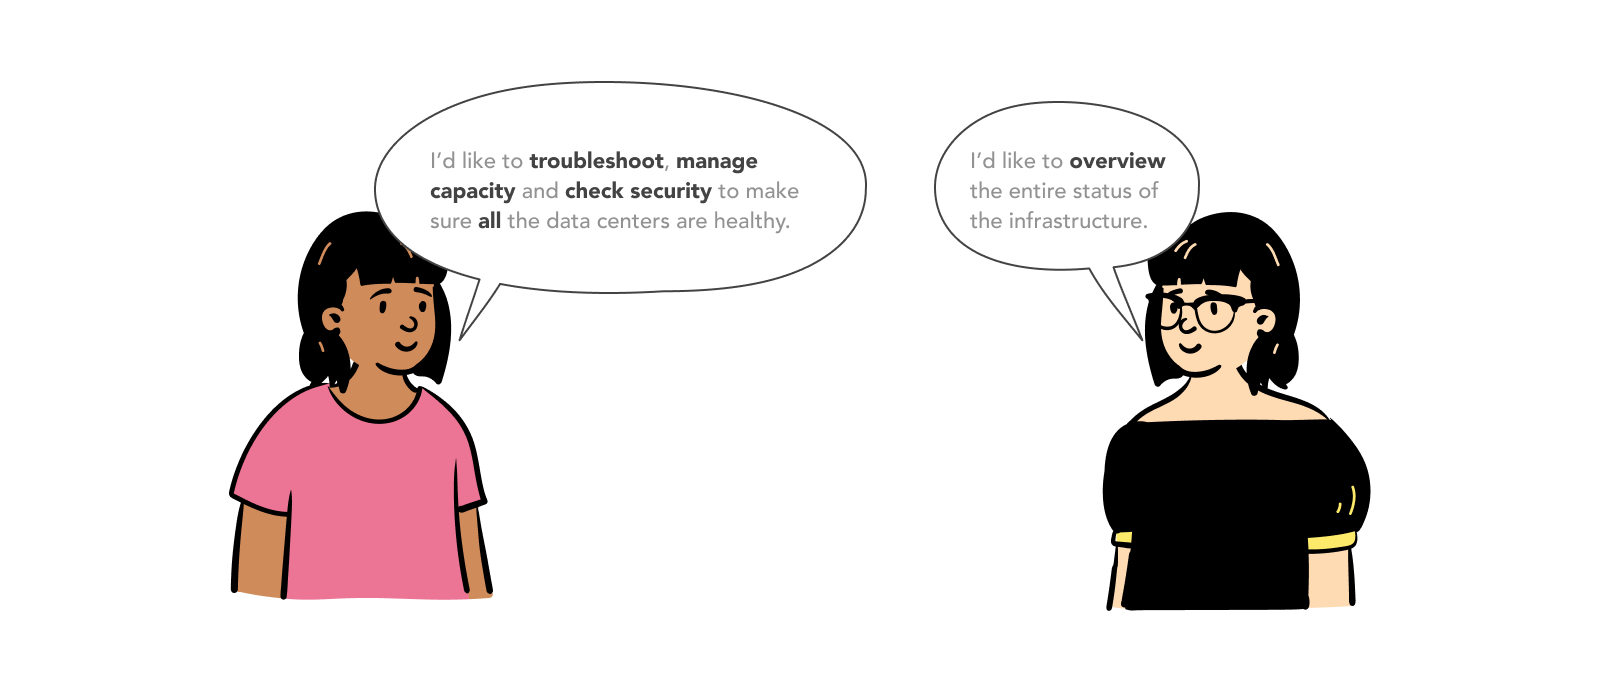
There are two target users, IT admin and IT director. The pain point from our current IT admins is that they are not able to manage their multiple data centers or multi-cloud collectively. And it is very significant to understand if the infrastructure is doing good as well as clear actions to bring the infrastructure back to normal. In the past, there is no visibility for the IT director to overview the status of current infrastructure because everything was only friendly for hands on users.

VMware Operations — target users persona

Design Principle

Based on what I found out from research sessions. We set up our principle for the infrastructure operations. Users should be able to quickly overview across all the deployments, manage their environment at a large scale, and understand the status by informative data.

Design principle: overview across all deployments
Design principle: large-scale environment management
Design principle: informative status data

Alignment Across Multiple Product Teams

There are other areas that need to be considered except the use cases. Translate use cases into user interface is the final phase that users can experience. Take a step back and look at the big picture. How does vSphere+ fit in the VMware Cloud? Do those use cases scalable? Define a clear information architecture becomes more important before we start the design phase. The first challenge was how to express the user expectation and align with other product teams for the ONE vision.

VMware Operations — information architecture diagram
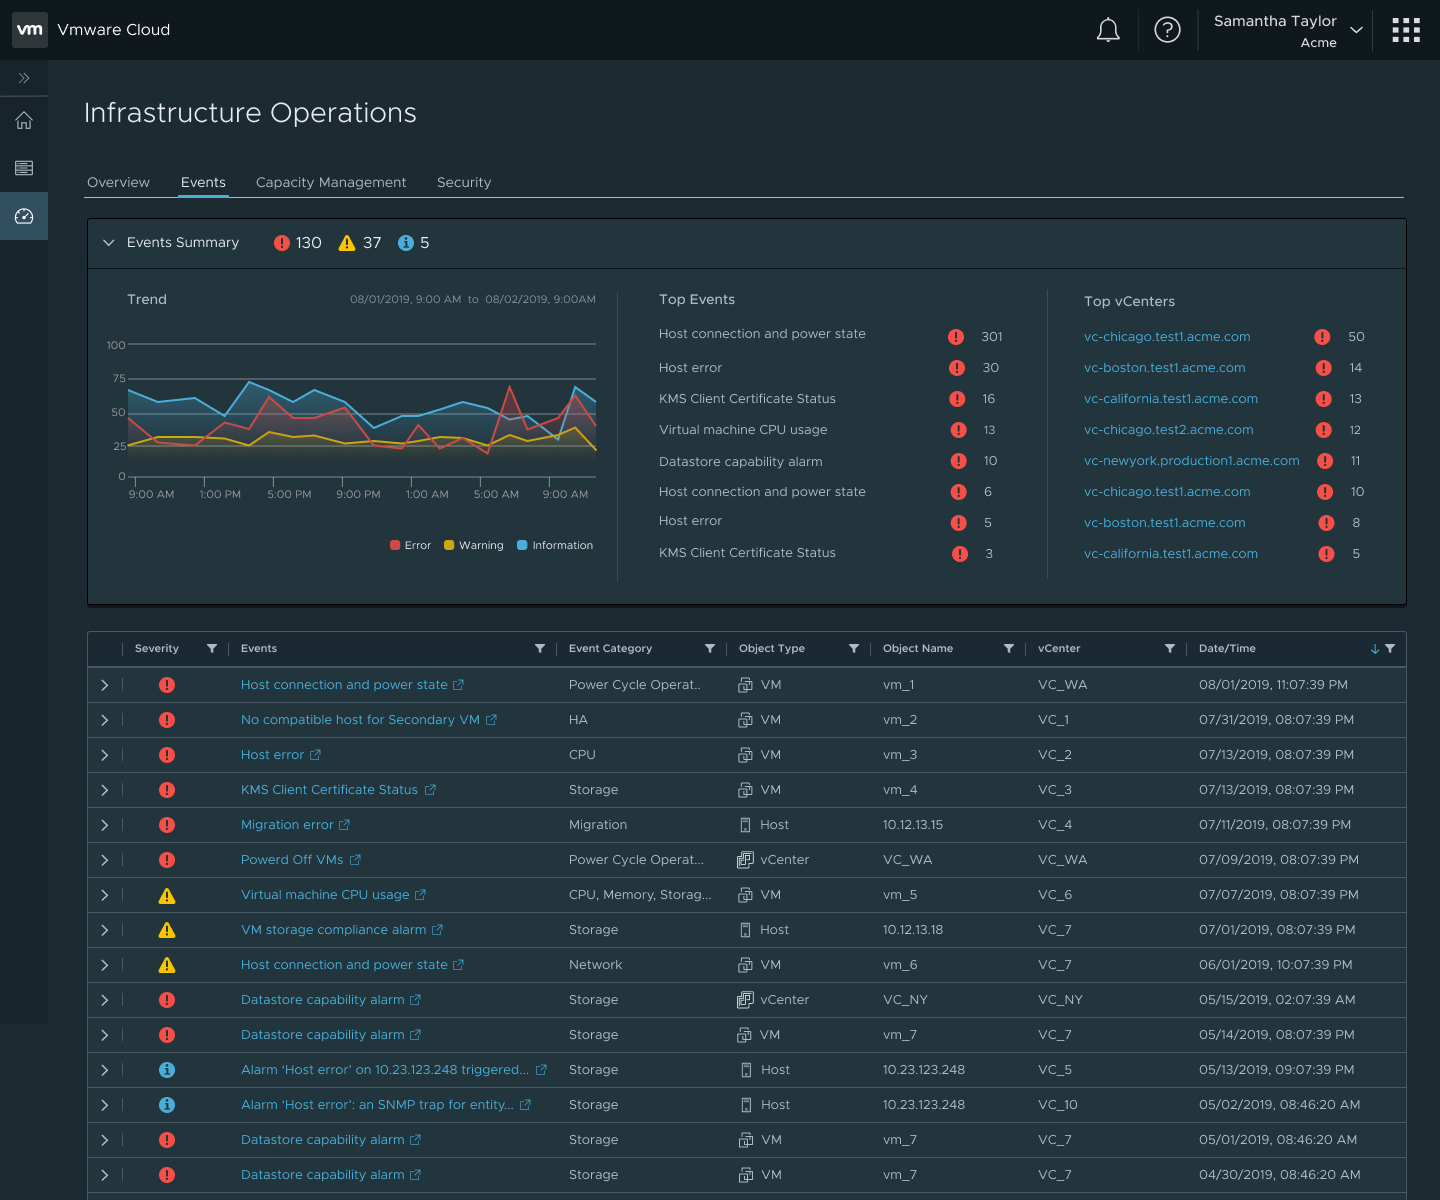
VMware Operations — events for troubleshooting design
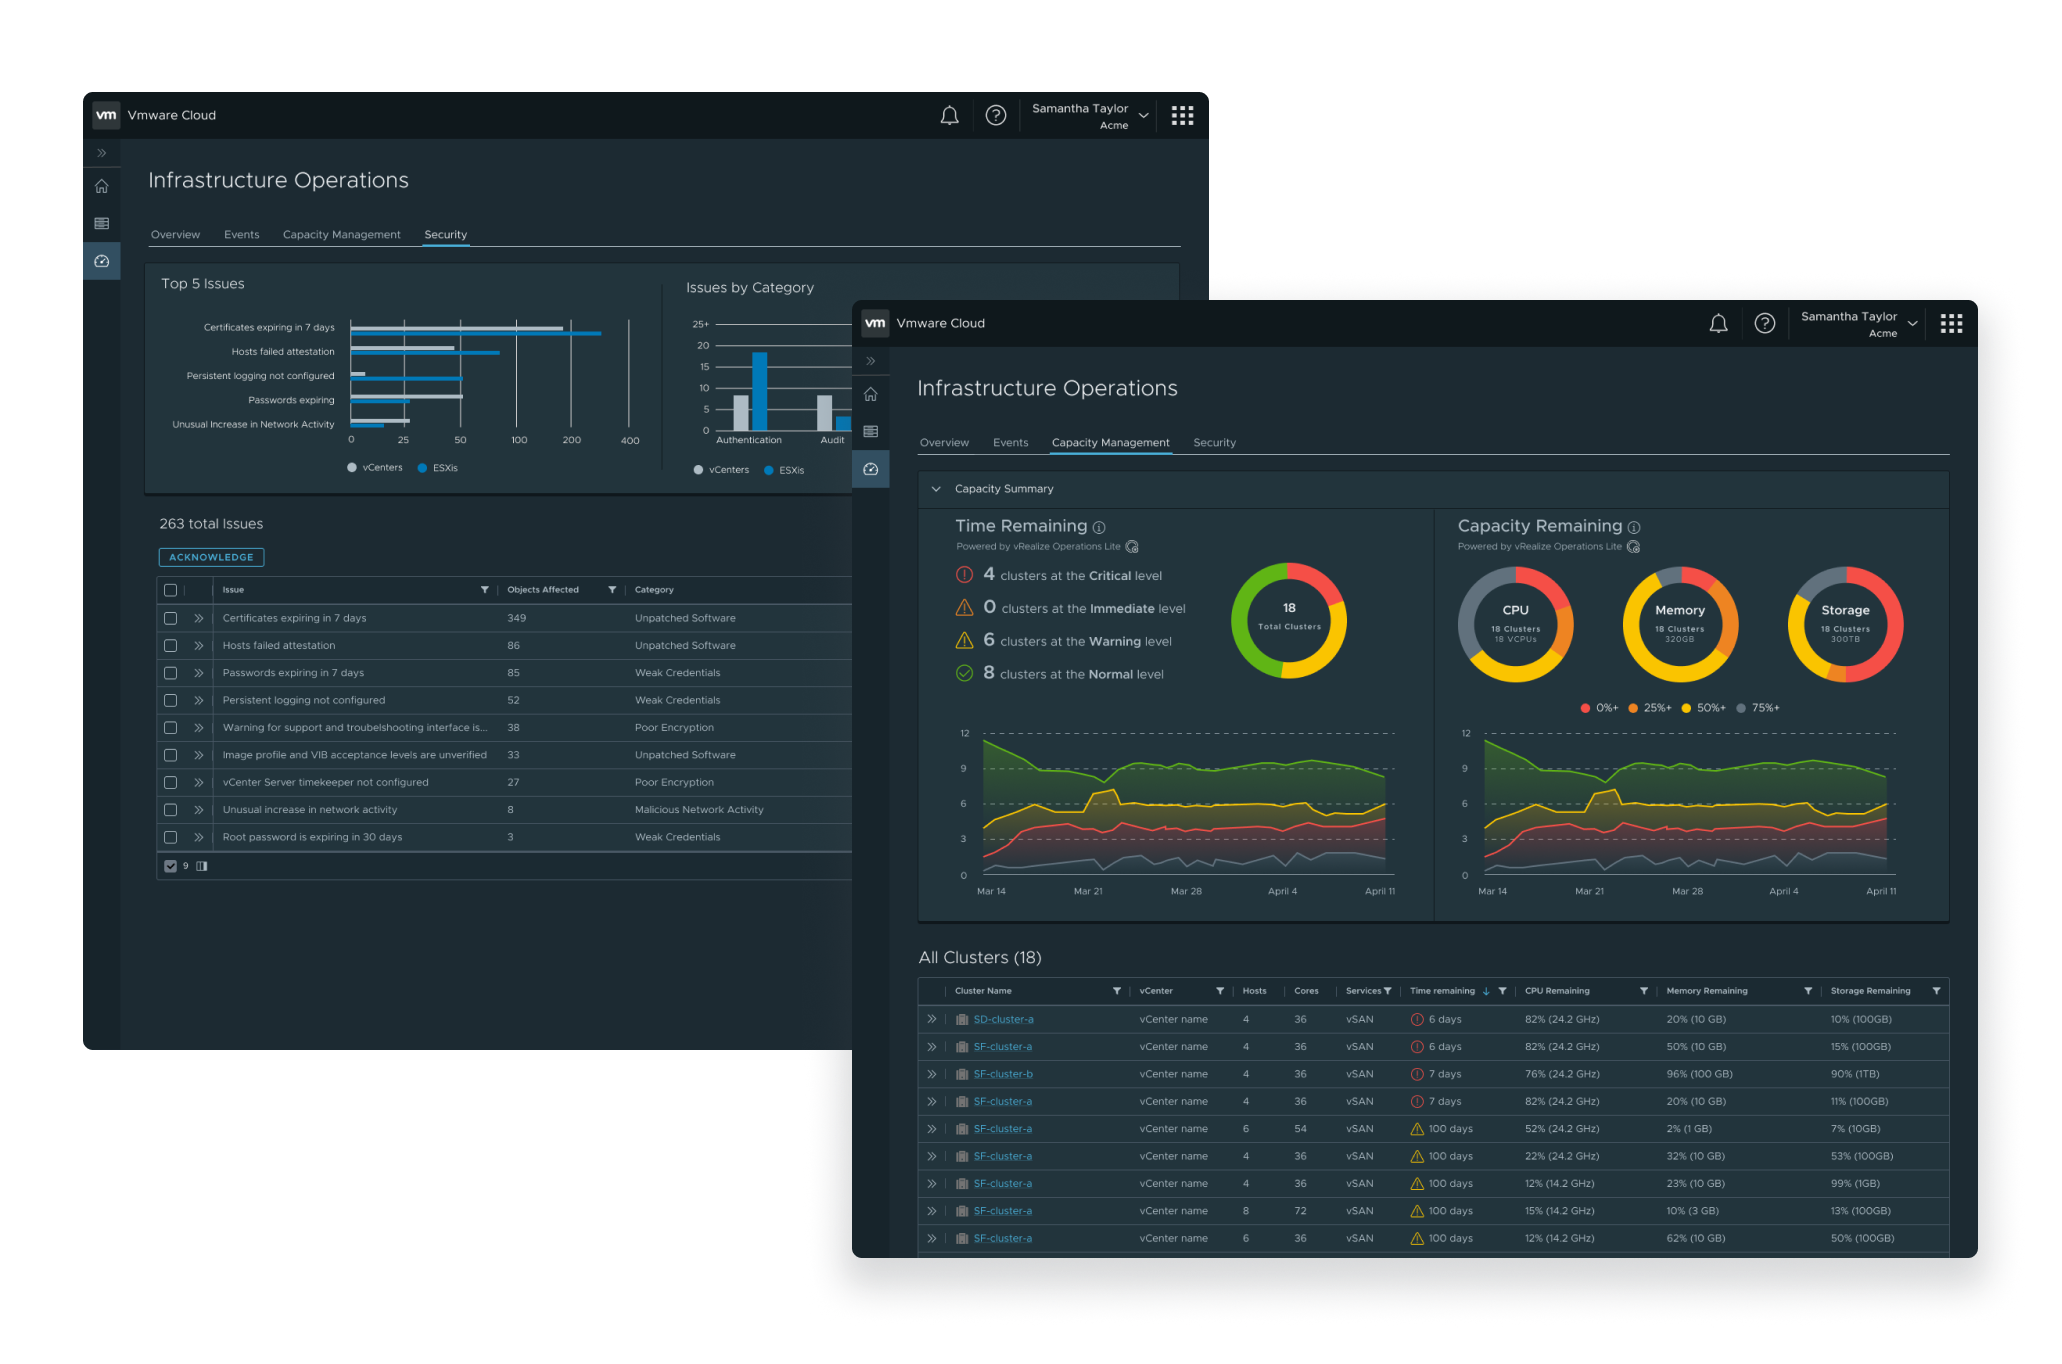
VMware Operations — capacity management and security design
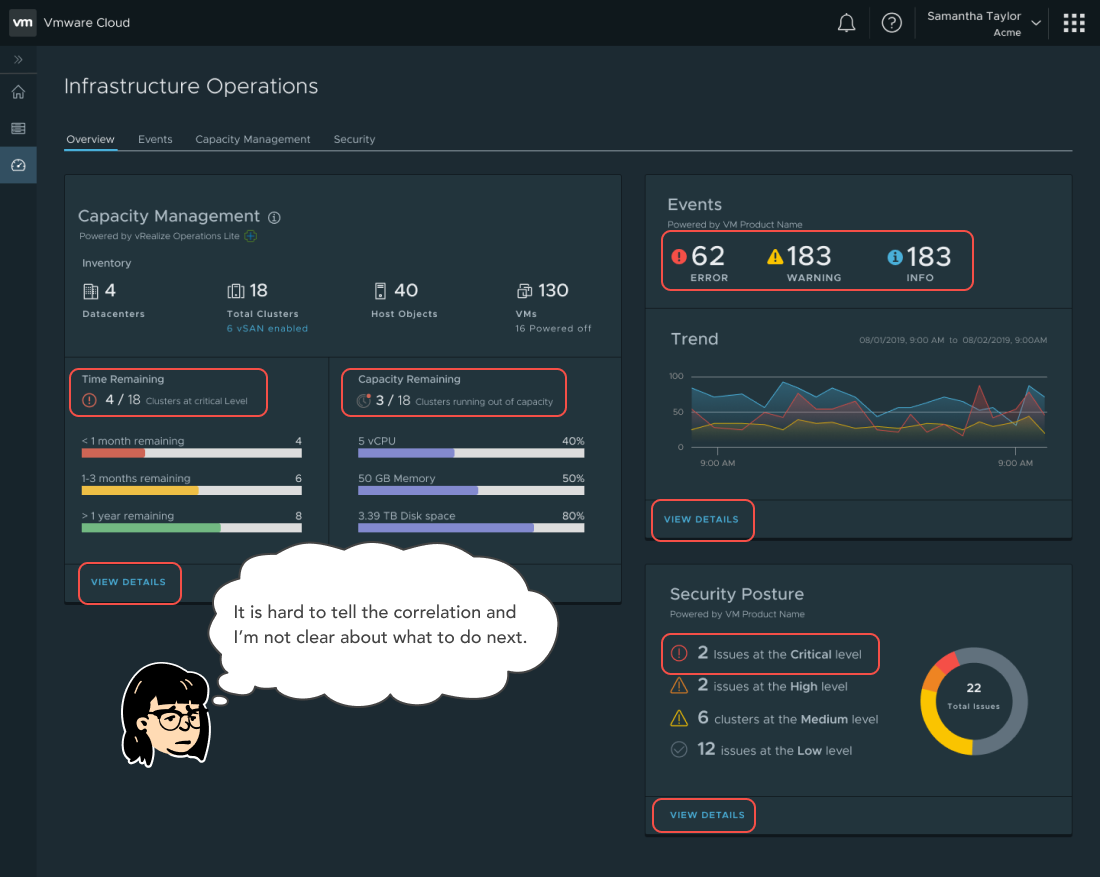
VMware Operations — broken overview dashboard (before redesign)

Design Challenge

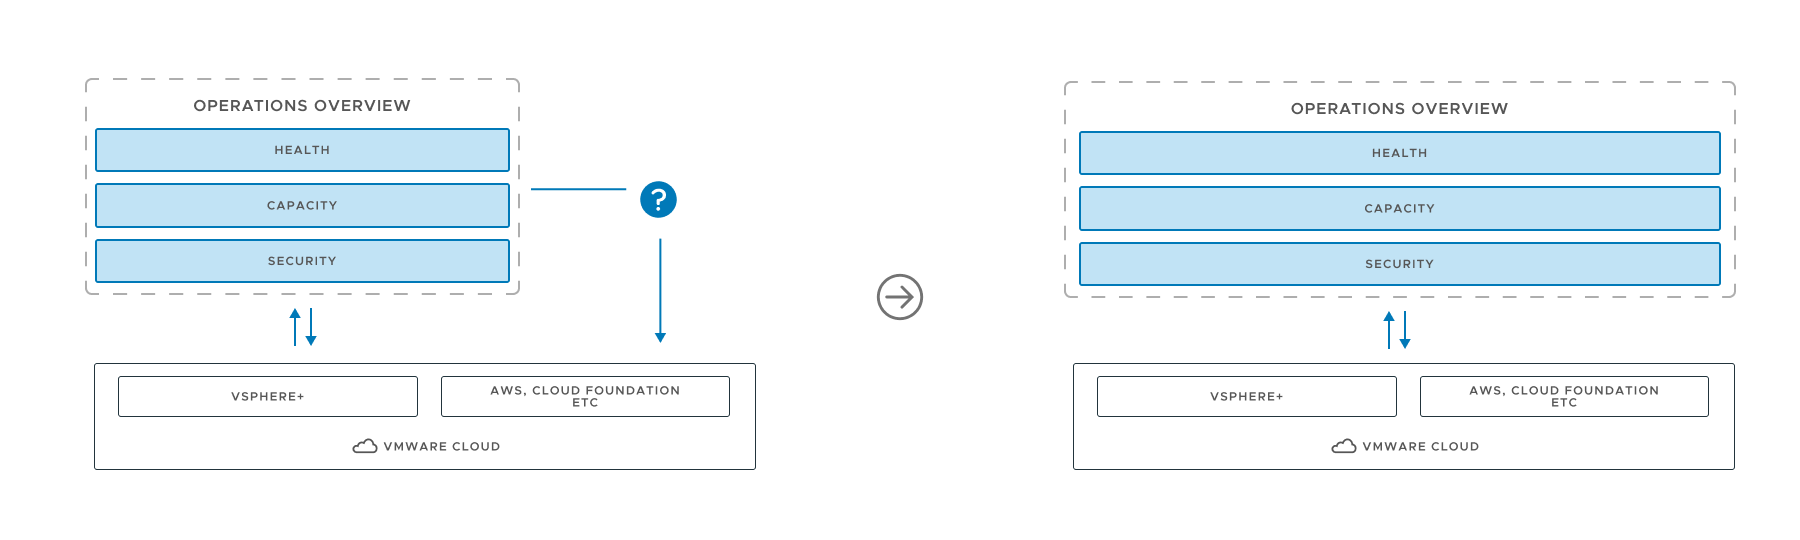
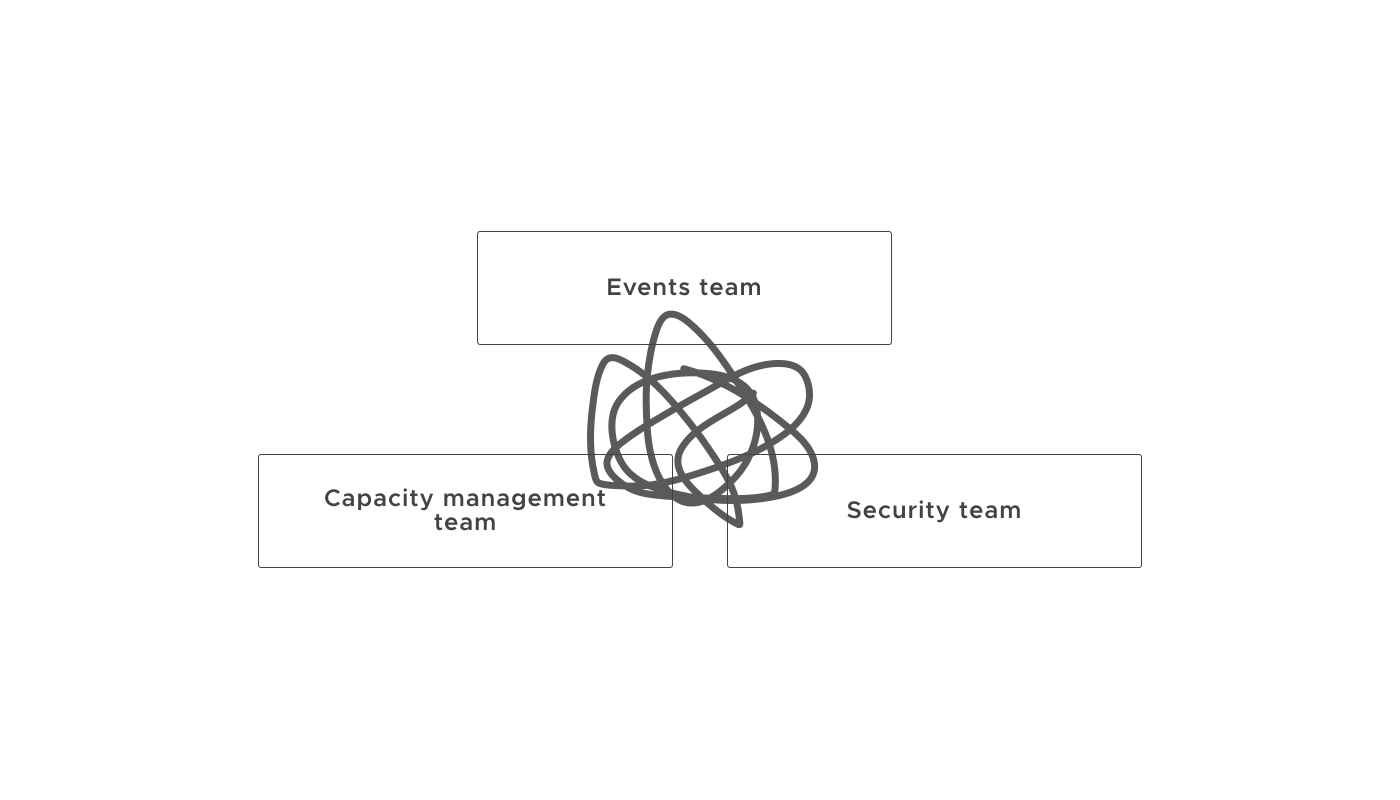
Events, capacity management and security are owned by three different teams across two business units. The gap took place when it came to an overlapped area that required collaborations. So I took the lead on revisiting the overview page, and aligned with designers and other stakeholders on the new proposal.

VMware Operations — design challenge diagram

Iterations

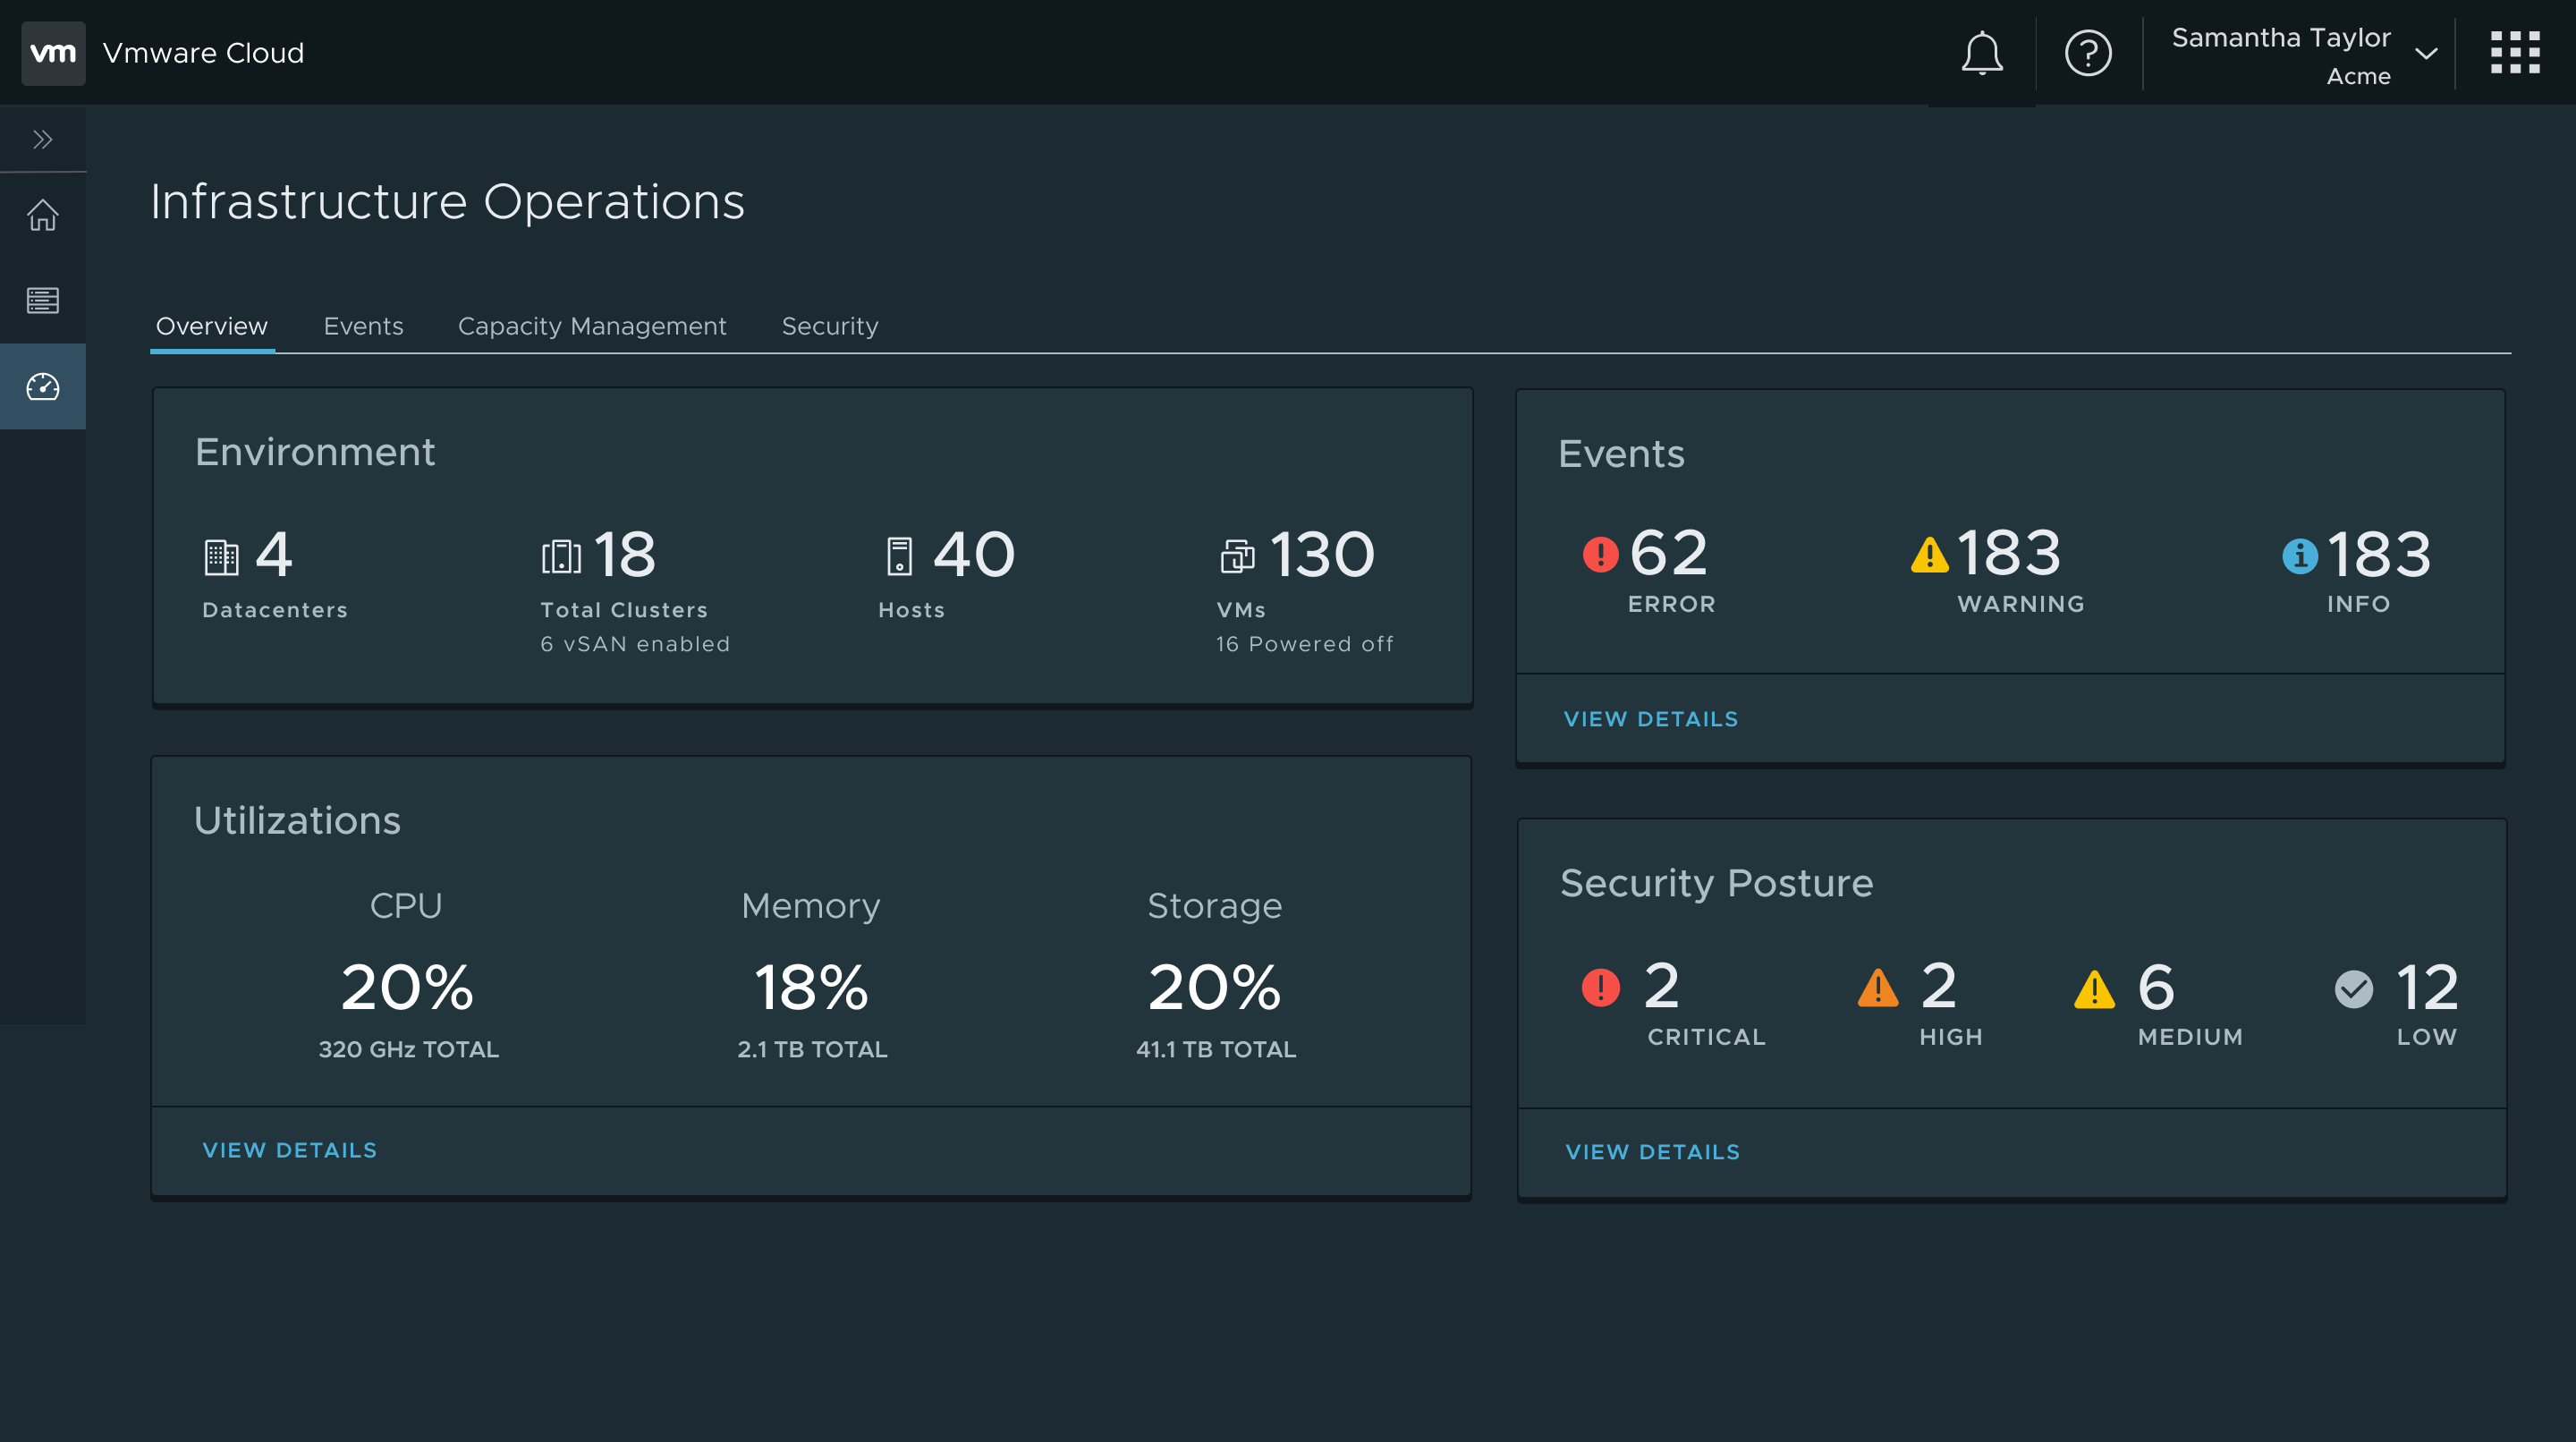
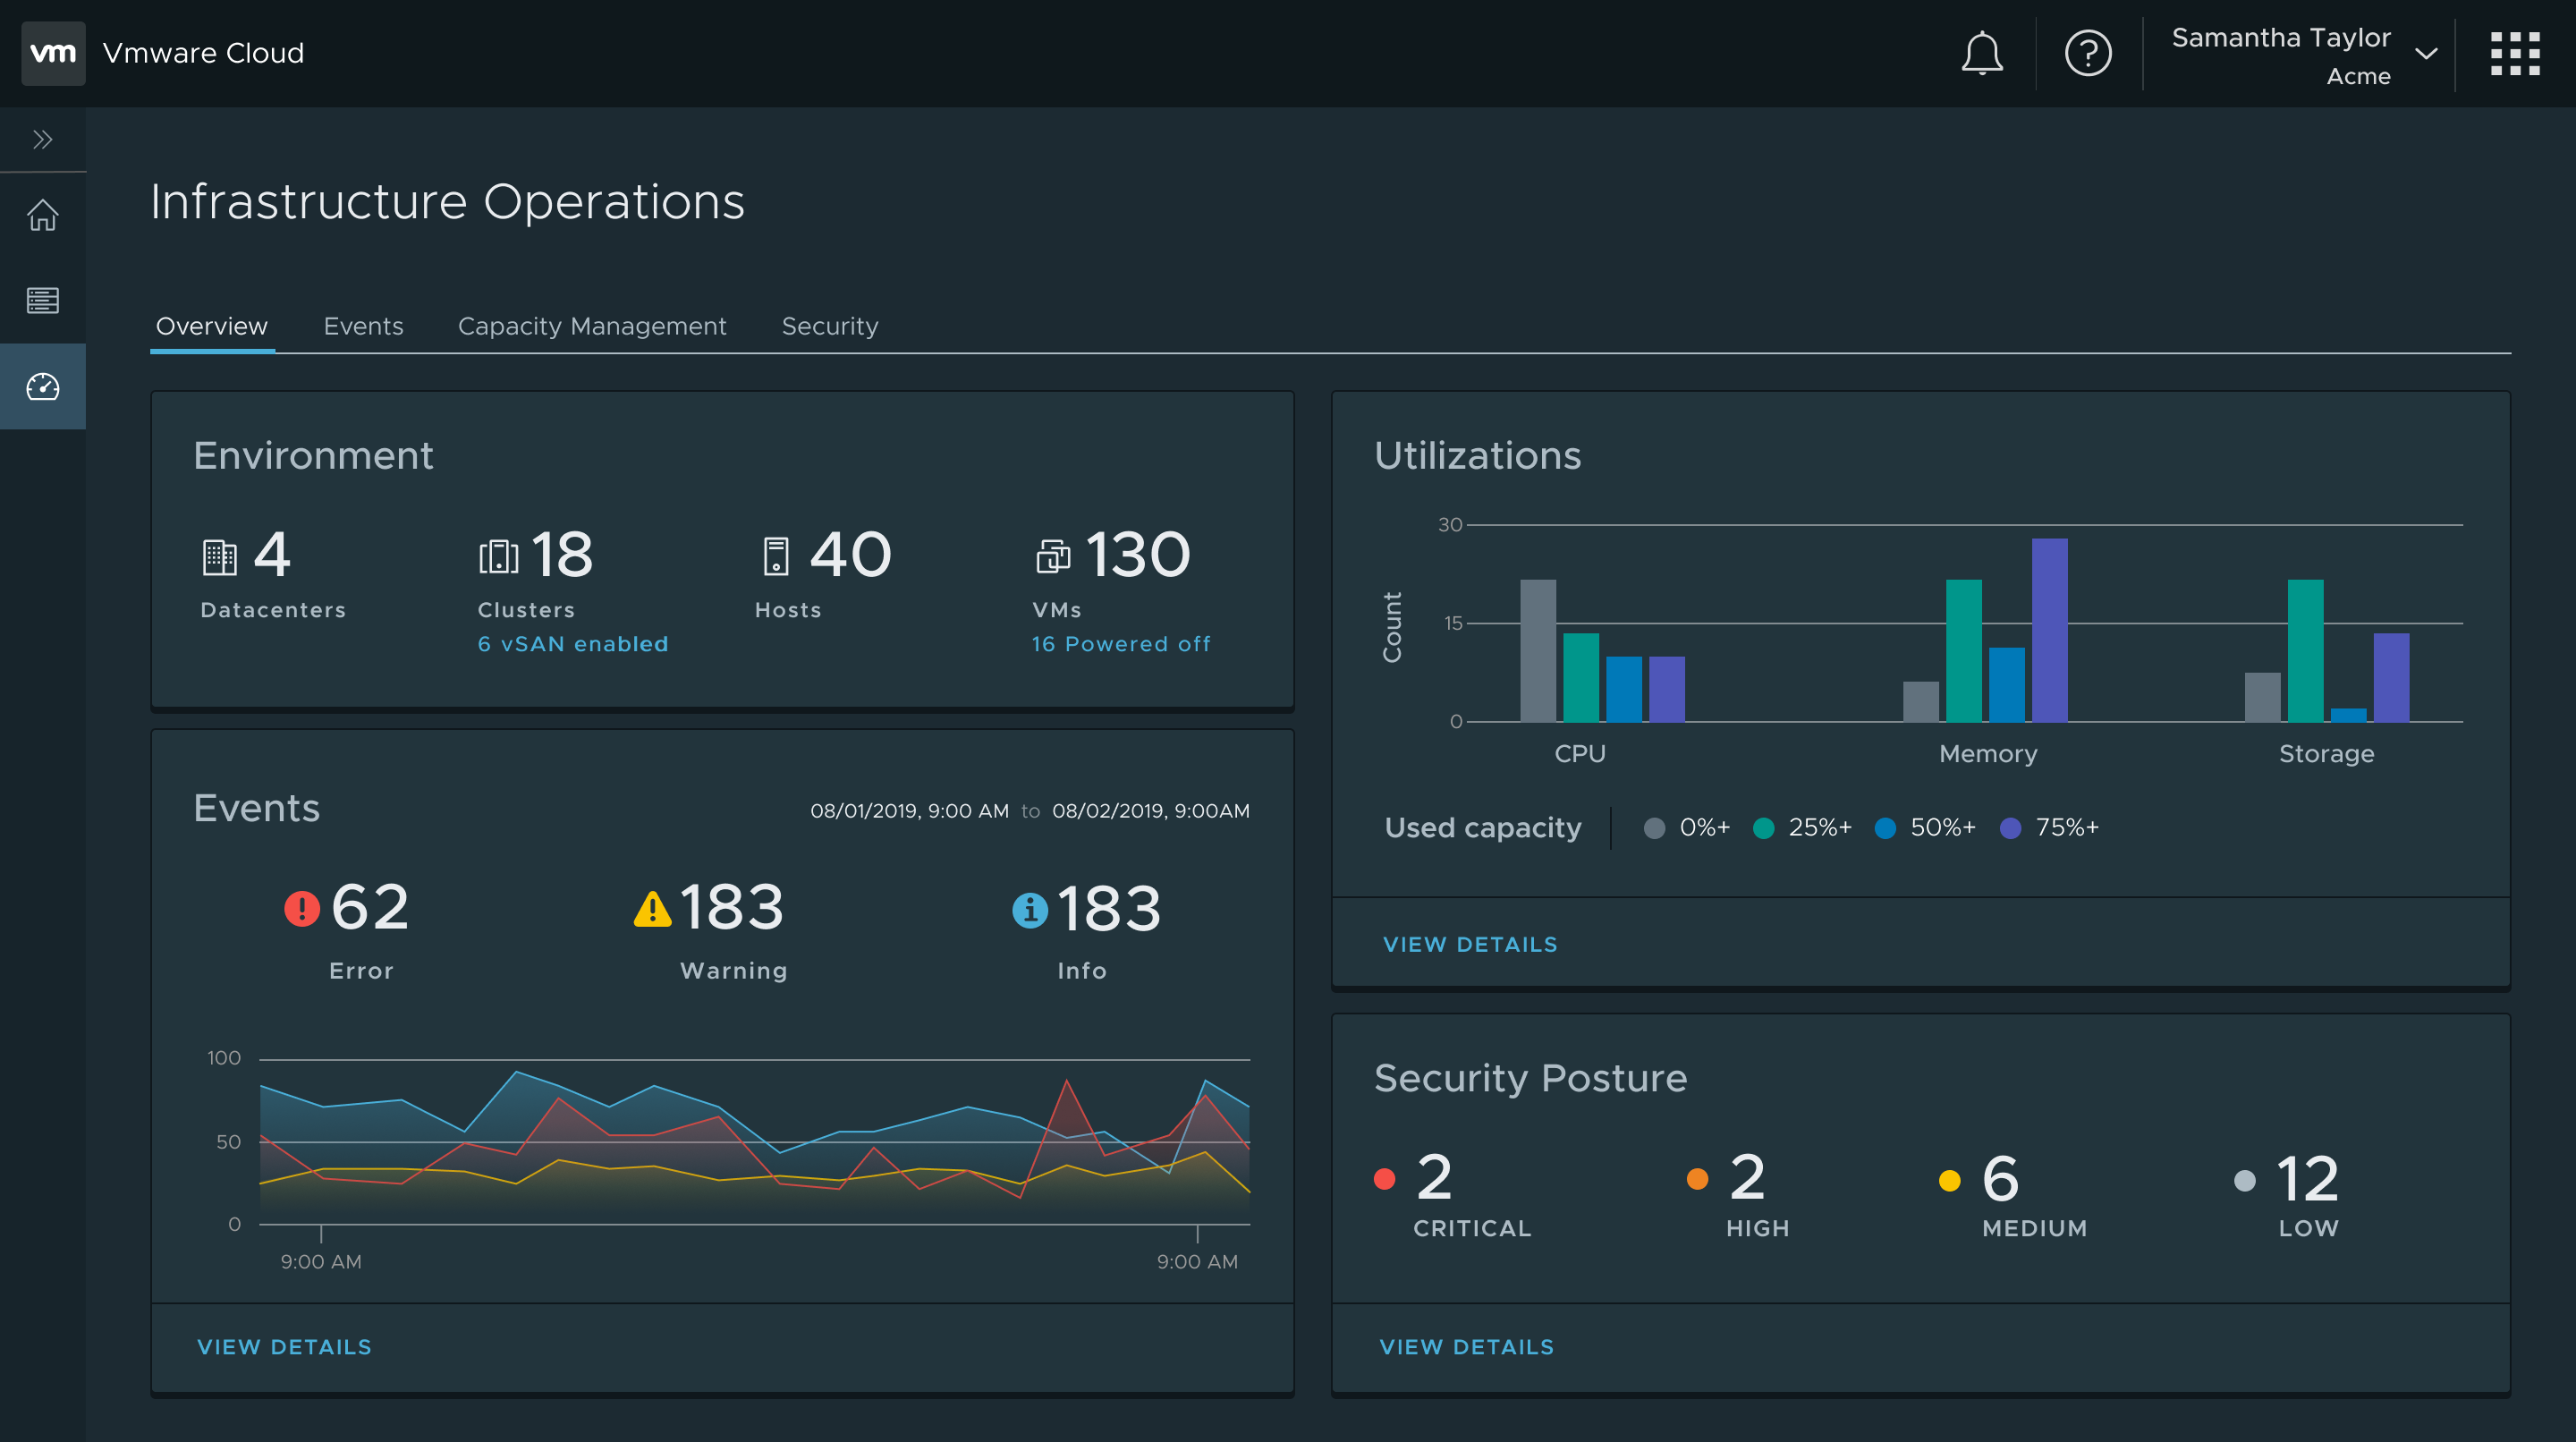
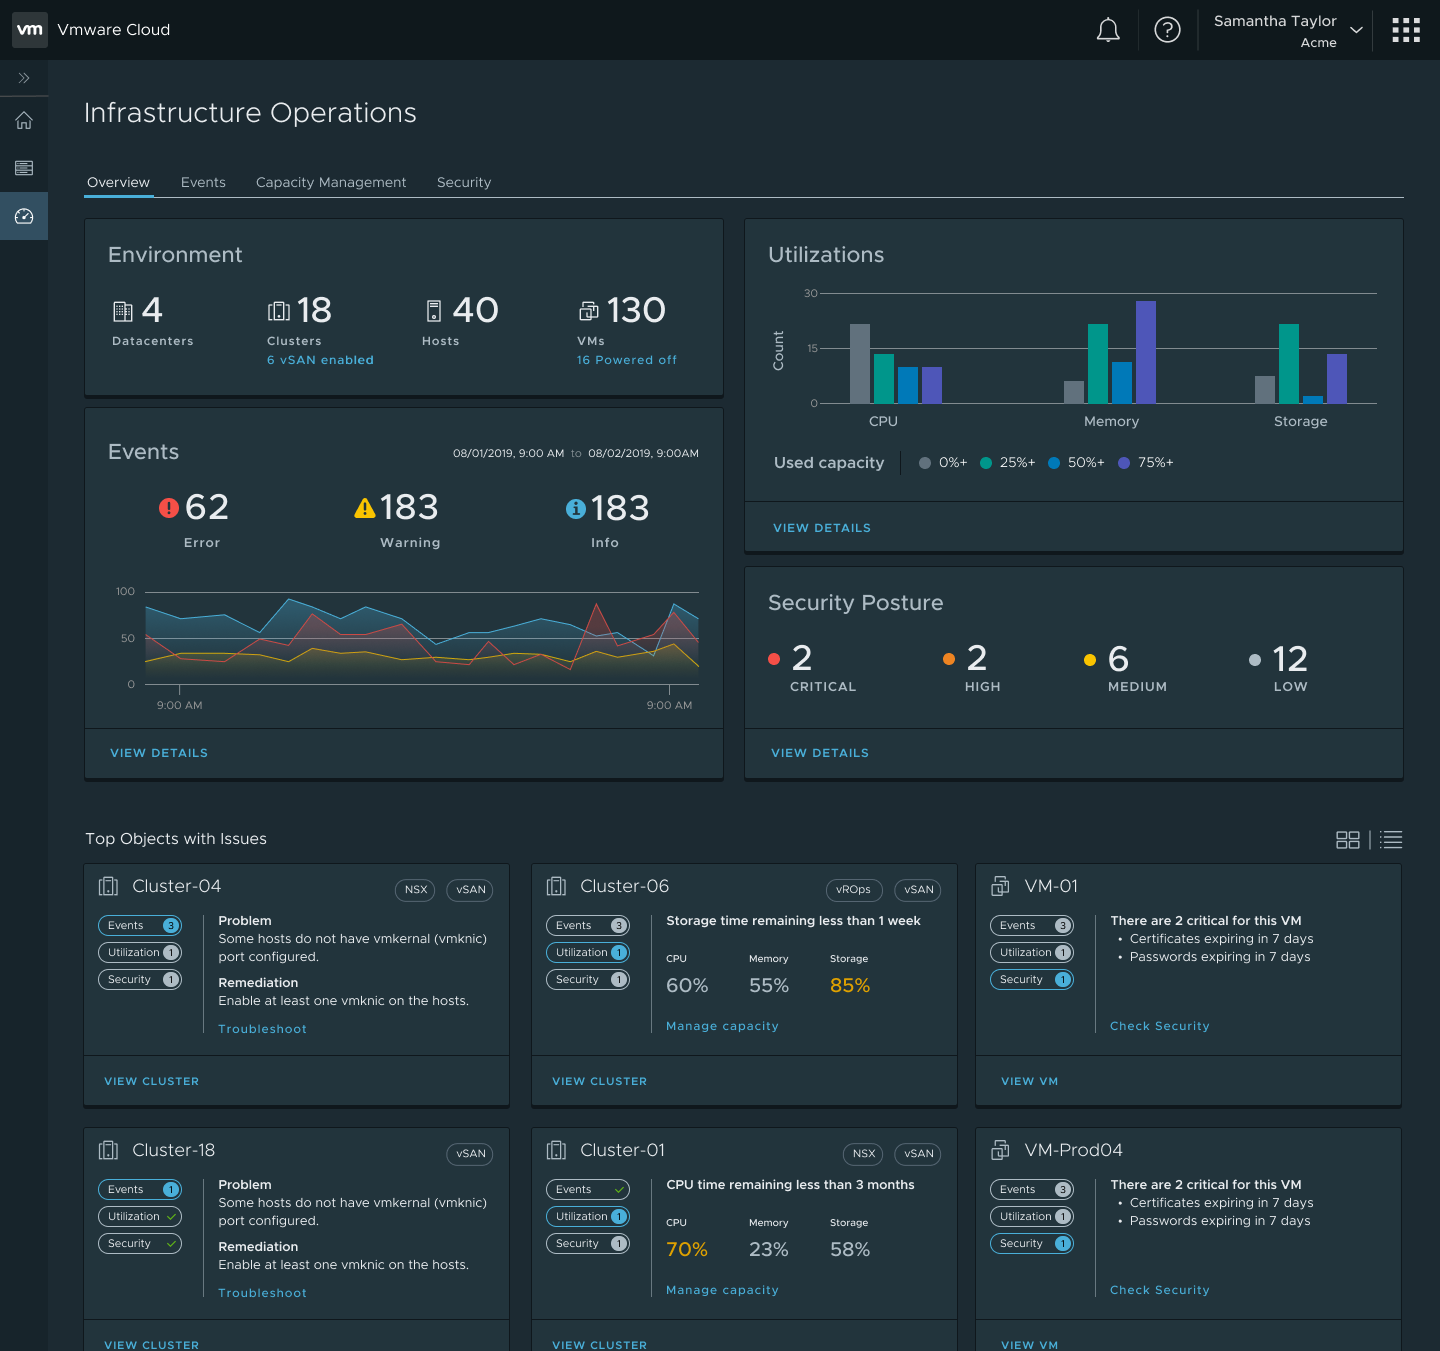
I began by focusing on the dashboard. Our initial goal was to streamline the data visualization process. We consolidated the numbers, ensuring consistent font sizes and weights. Visually, this approach resulted in a cleaner look. However, we recognized that we had initially underestimated the impact of incorporating charts. Pure numerical data alone doesn't effectively convey how the health of the infrastructure evolves over time. Charts provide a clearer indication of issue severity, making it easier for users to interpret. Nevertheless, we acknowledged that simply adding charts didn't entirely address the need for a comprehensive overview of the environment. Consequently, we meticulously selected charts that contributed to a more coherent narrative.

VMware Operations — overview dashboard design option 1
VMware Operations — overview dashboard design option 2

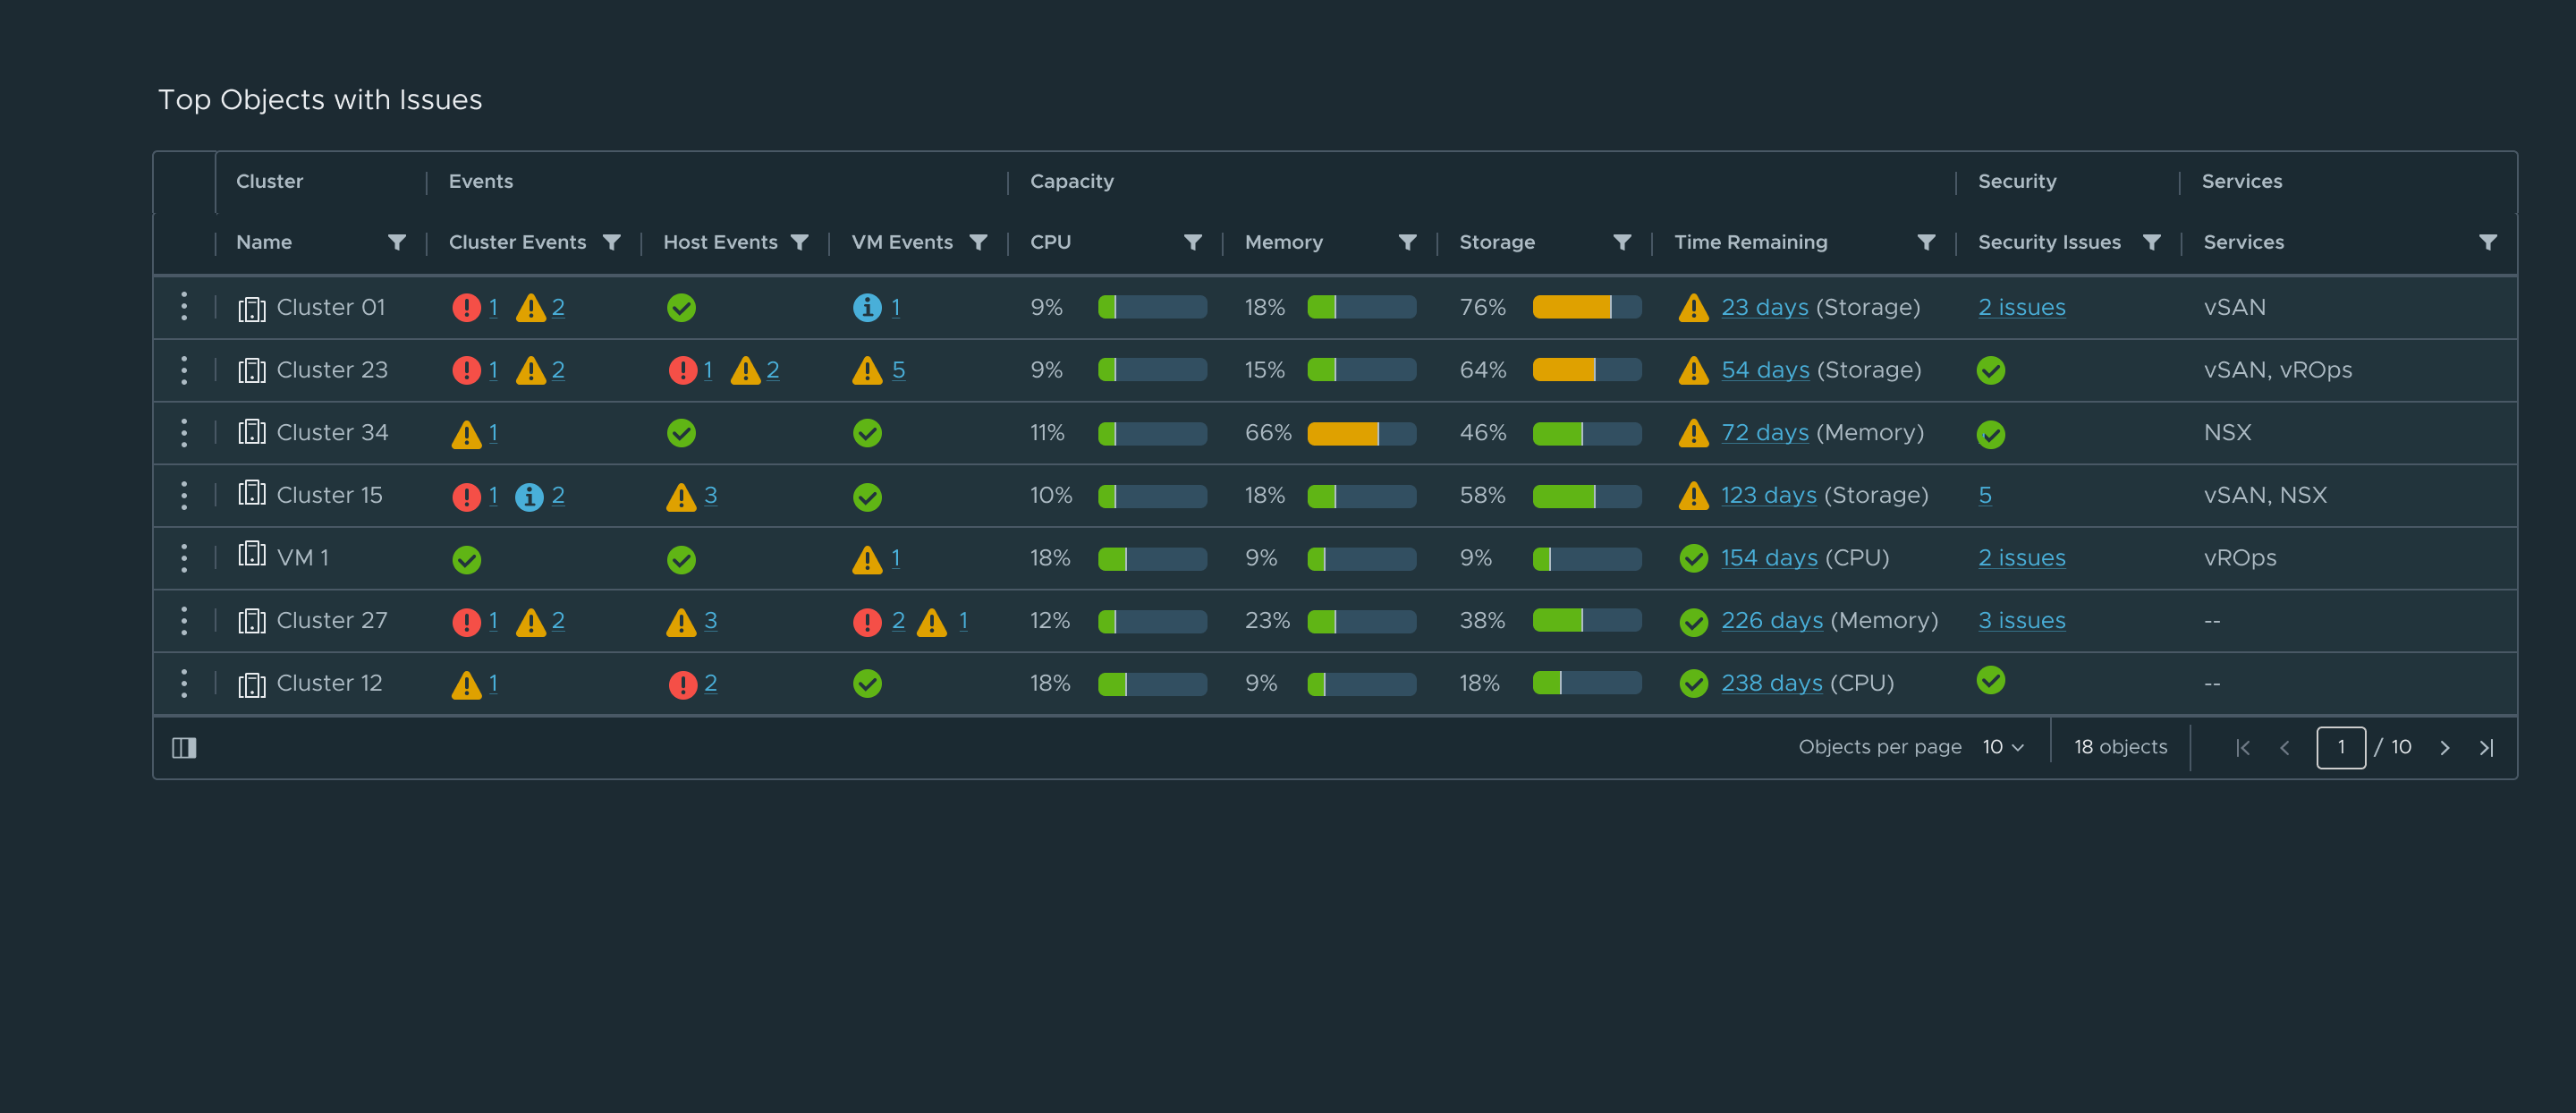
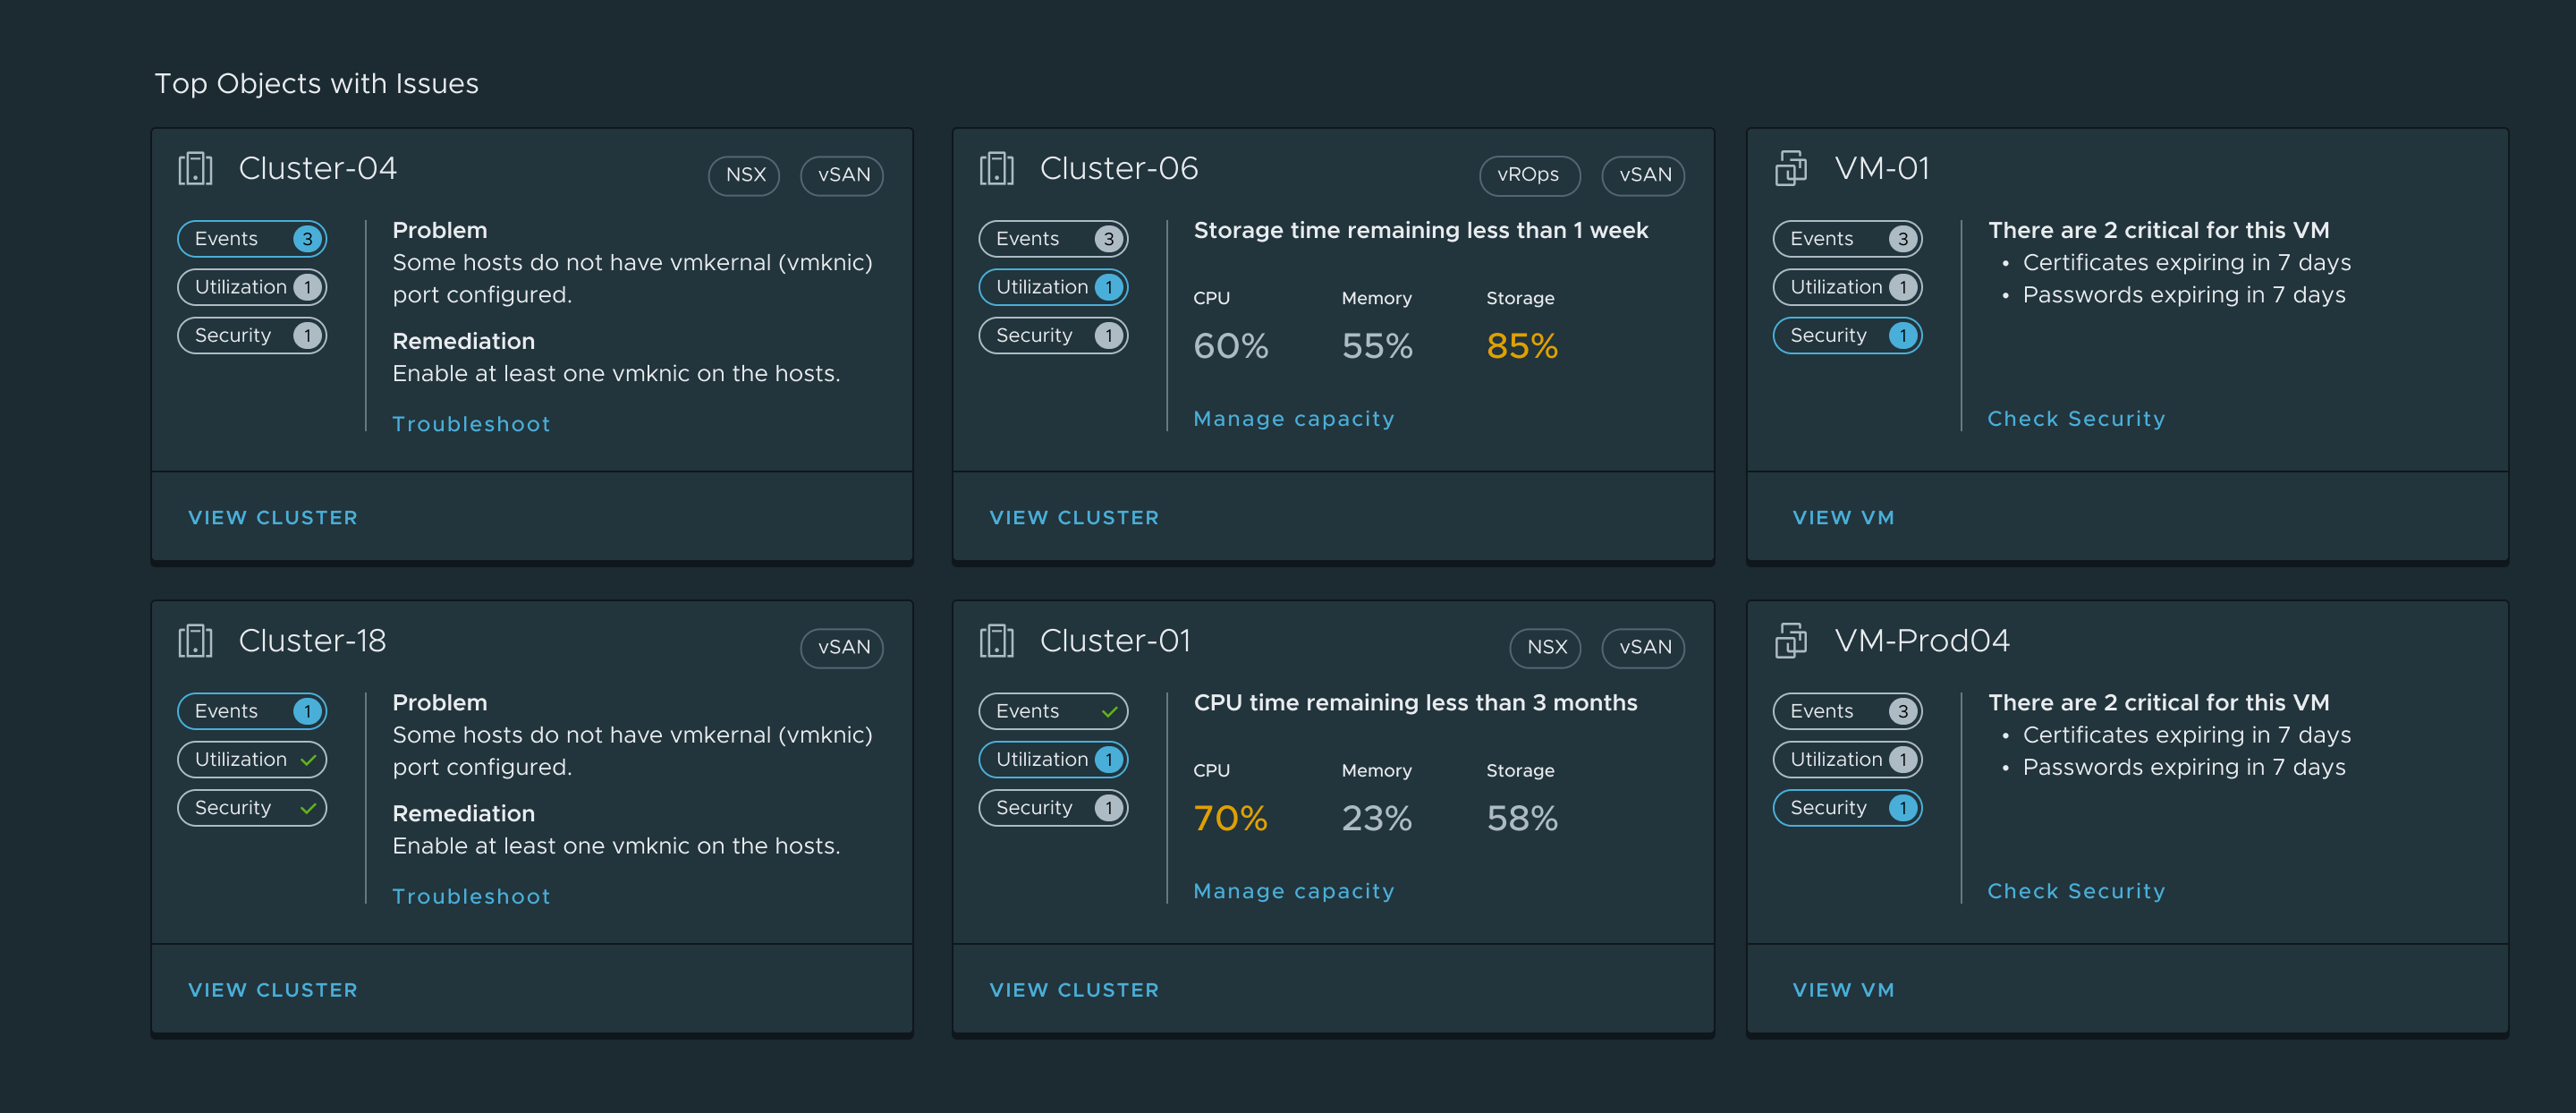
We've now completed the overview, but does it truly conclude the narrative? Does it effectively address the challenge faced by the IT director? Upon delving into the overview, it becomes evident that while it provides a solid starting point, the IT director requires more actionable steps beyond simply 'viewing details'. To address this, we explored various options to highlight and prioritize critical elements. This empowers the IT director to efficiently delegate tasks to their teams. We experimented with both the list view and card view, initially intending to choose between them. However, the feedback we received was even more inspiring. The list view streamlines the process for users to swiftly navigate through all object entries at a glance. In certain cases, users may have multiple actions to choose from an object. Then the card view proves more effective in facilitating user interaction. It's important to note that there's no definitive right or wrong choice at this stage. These options serve to assist users in achieving different objectives.

VMware Operations — detail view design option 1
VMware Operations — detail view design option 2
VMware Operations — final redesigned overview dashboard

Accessibility Check

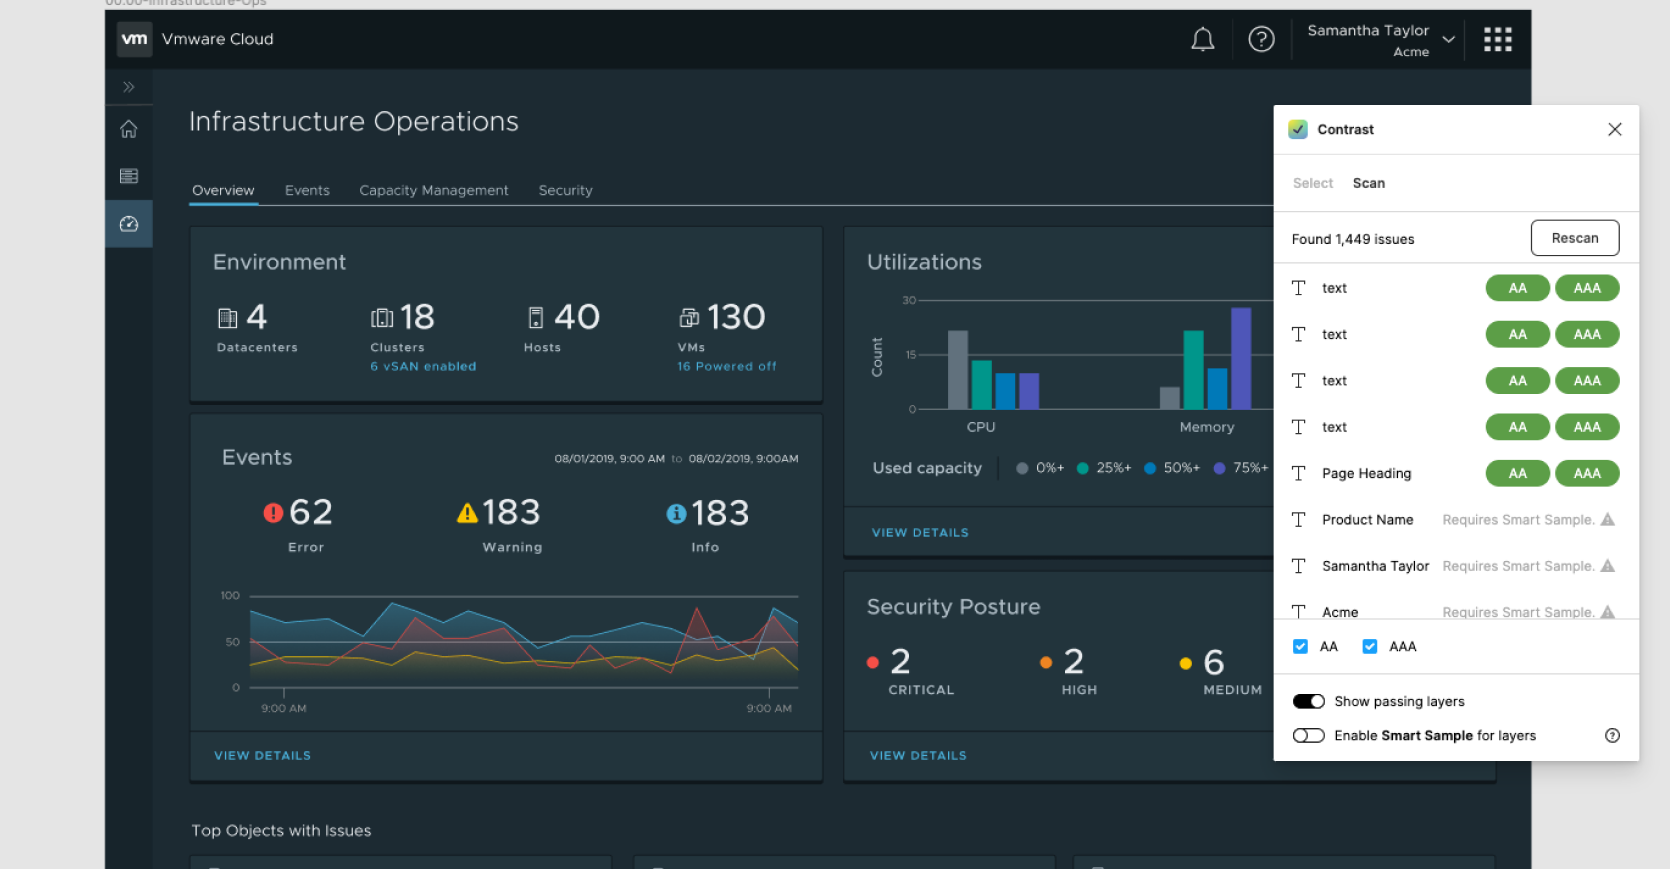
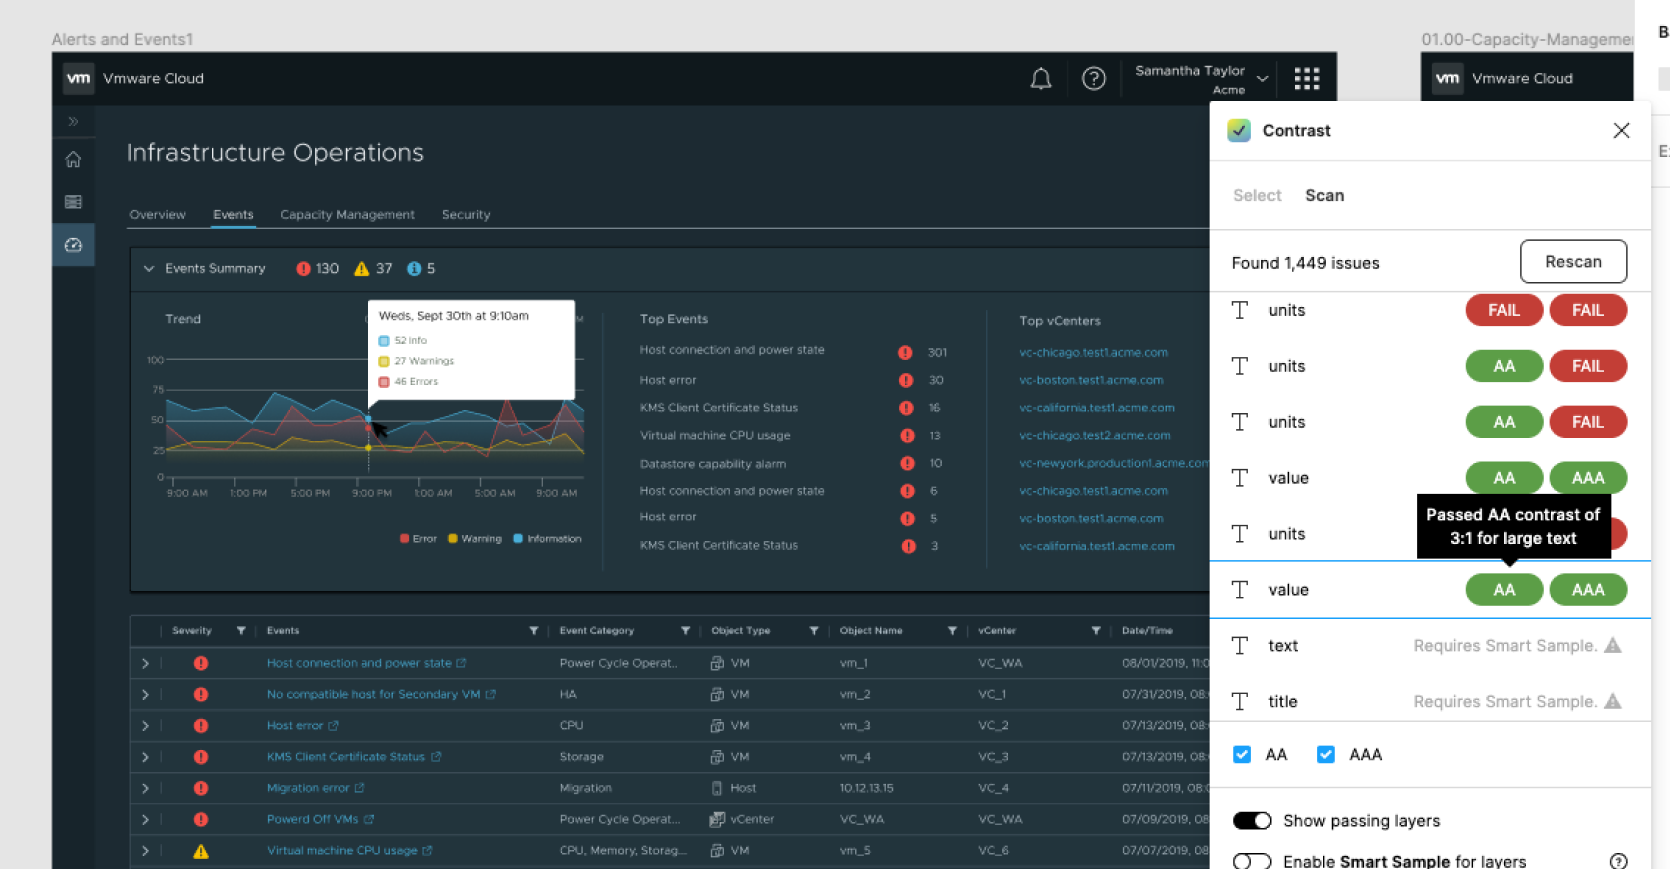
The last step is to make sure all the designs are checked by accessibility guidance. On the mockups, we run the accessibility check directly on Figma. For motion graphics, I co-founded the first motion design library including the motion accessibility guideline. The motion follows the criteria when we deliver the final output to engineering.

VMware Operations — accessibility check: color contrast
VMware Operations — accessibility check: component review

Metrics

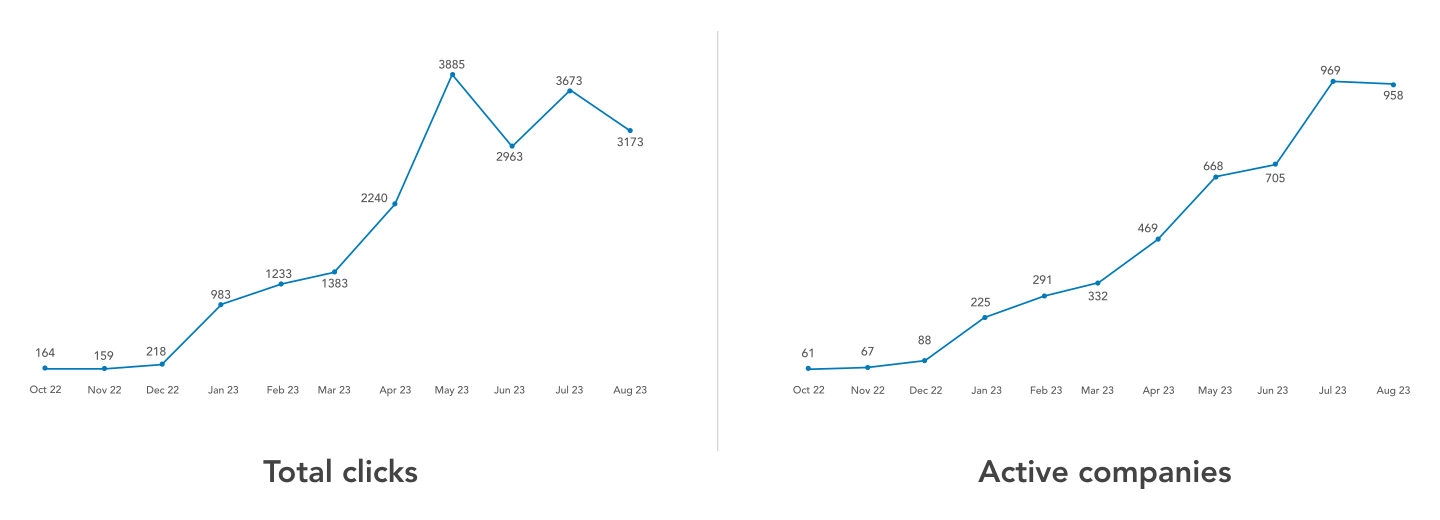
1. Adoption: By tracking the total clicks, it is easy to understand that users are using the feature. But the total usage might be contributed by the certain customers. By referring to the growth of companies which are using the feature helps. If there is a postive relevance means that the growth of the clicks matches the growth of customers.

VMware Operations — success metrics

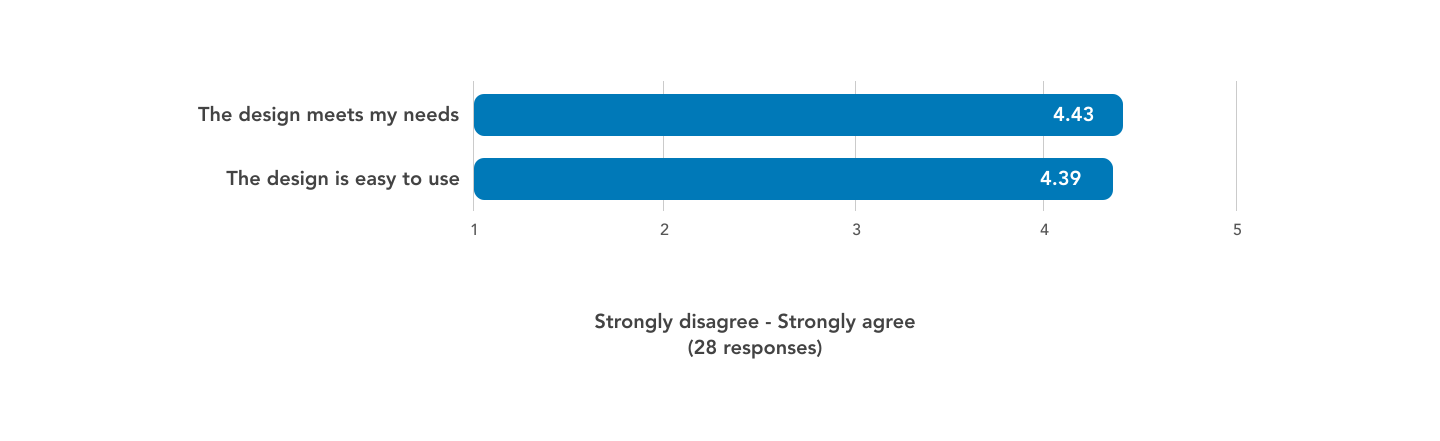
2. Satisfaction: In addition to understand the feature is well adopted and used by the customers. But it doesn't mean the UX is good. By using UserZoom, it is easy to know if the design meets users' needs and if the design is easy to use. VMware Operations — learnings and user satisfaction rating
Learnings

1. Take the ownership as a lead: Whenever I find an issue which is or will impact end users, it is always a responsibility to call it out and plan a solution to address it;
2. Proactive Communication: In order to get alignment, it requires tons of communications to shape and clarify a vague goal. Never worry over communication, communication helps team succeed;
3. Embrace uncertainty: There is always something that I don't know. Ask and learn is a better approach than complaining or doing nothing.